Table of Contents
Report Builder
What is the Report Builder?
The report builder is a tool in DGS used to create new reports or edit and modify existing reports. It is located in the tree of all sites.

If it does not show up then the required permissions have not been set.
Report Builder Body
When creating a new report, the body of the report will look like this:
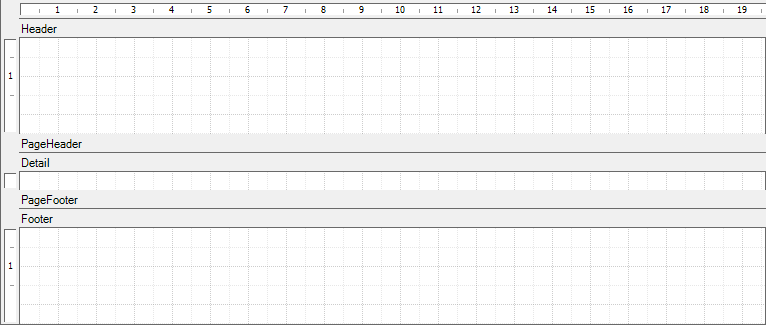
- The Header is located at the top of the report.
- The PageHeader is located at the top of each page. When using the graph tool place the graph here.
- The Detail Section will have a row for each row selected.
- The PageFooter is located at the bottom of each page.
- The Footer is located at the bottom of the report.
Report Builder Toolbar
The Report Builder Toolbar has a variety of tools to use. It is found under the tabs section when a builder is open.
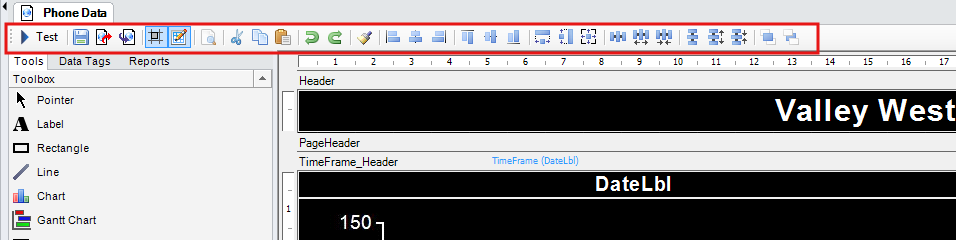
Each tool is described below.
| Icon | Name | Description |
|---|---|---|
 | Test | Using this button allows testing of what has been made in the Report Builder. Once pressed, it is replaced with a close button which cancels testing and returns to the builder. |
 | Save | Use of this button saves all changes made to the report. |
 | Export | Using this button Exports the report into a .vwr file. |
 | Import | Using this button imports a .vwr file into the builder. |
 | Snap To Grid | Using this button allows each field to snap to the Grid on the builder section. When it is highlighted blue it is turned on. |
 | Show Grid | Using this button shows or hides the grid. When the button is highlighted blue the grid will show. |
 | Search Report | Use of this button allows for a search to the entire report (Query, Data fields, Labels) for specific lines/words. |
 | Cut | Use of this button cuts the current selected field and copies it to the clipboard. |
 | Copy | Use of this button copies the current selected field to the clipboard. |
 | Paste | Use of this button pastes what is currently copied to the clipboard. |
 | Undo | Use of this button reverses the last change made. Can be used multiple times. |
 | Redo | This button steps forward after going back too far with undo. |
 | Same Style | This button applies all of the same styles of one field to another field. |
 | Align Lefts | Use of this button aligns all boxes left sides. |
 | Align Center (Horizontal) | Use of this button aligns all boxes centers Horizontally. |
 | Align Right | Use of this button aligns all boxes rights. |
 | Align Top | Use of this button aligns the tops of all boxes selected. |
 | Align Center (Vertical) | Use of this button aligns all boxes centers vertically |
 | Align Bottom | Use of this button aligns the bottoms of all boxes selected. |
 | Same Width | Makes all selected boxes the same width. |
 | Same Height | Makes all selected boxes the same height. |
 | Same Size | Makes all selected boxes the same size. |
 | Equal Horizontal Spacing | Makes all selected boxes the same distance apart horizontally. |
 | Increase Horizontal Spacing | Makes all selected boxes distance increase between them horizontally. |
 | Decrease Horizontal Spacing | Makes all selected boxes distance decrease between them horizontally. |
 | Equal Vertical Spacing | Makes all selected boxes the same distance apart vertically. |
 | Increase Vertical Spacing | Makes all selected boxes distance increase between them vertically. |
 | Decrease Vertical Spacing | Makes all selected boxes distance decrease between them vertically. |
 | Bring to Front | Brings the selected field to the front layer of the report. |
 | Send to Back | Send the selected field to the back layer of the report. |
Report Builder Tools/Data Tags/Reports Tab
The report builder has Three tabs, labelled as Tools, Data Tags, and Reports.
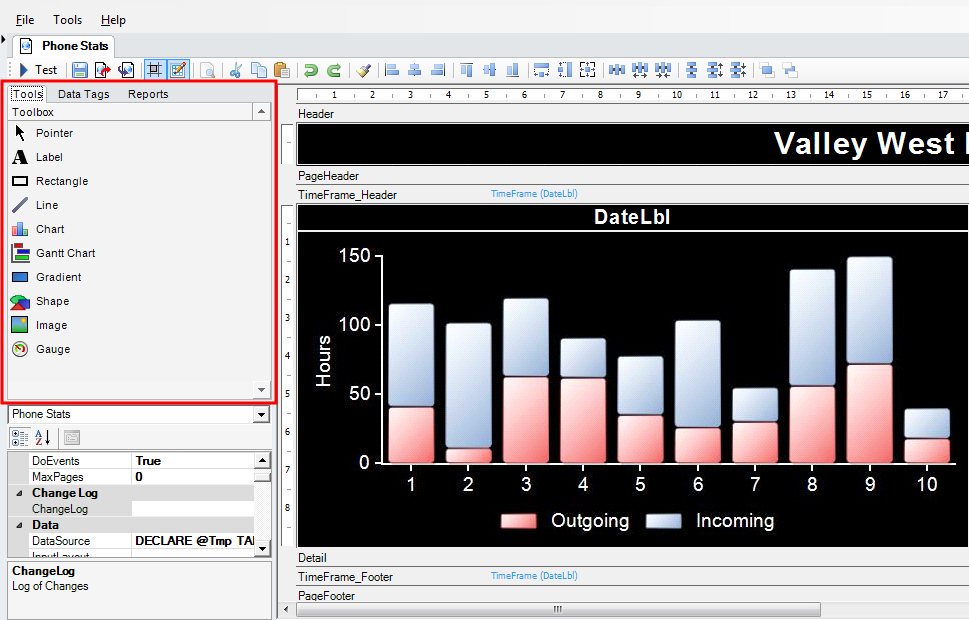
Tools Tab
The tools tab has all the tools necessary to build the front end of the report. Links to each tool and their use is below.
Data Tags Tab
The data tags tab allows for easy access to items selected out in the query. Clicking and dragging one of the fields to the report will put the field on the builder. If the “Add Label” button is pressed, it will add a label with each datatag.
Reports Tab
The reports tab is used for creating/deleting subreports. To add a subreport to the builder, use the SubReport tool in the tools tab.
Properties Section
When no fields are currently selected on the report builder, there is a default property list.
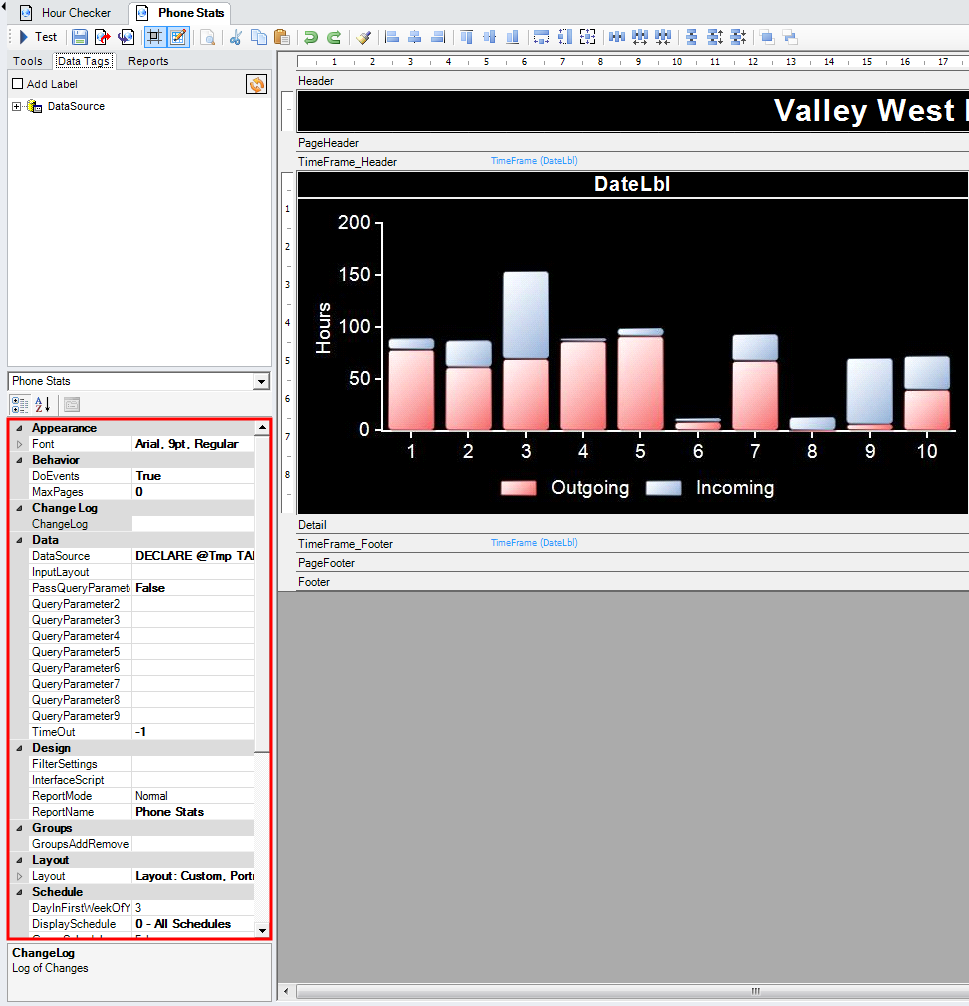
The most important of these properties is the data source.
Data source of the Report Builder
The data source of the report builder is the query creator/editor. It can be opened by pressing the … button when the property is clicked on. To write a custom query, the “user-defined query” box must be turned on. All data to be displayed will have to be selected out in the data source. The language used is SQL.
After opening up the report builder and making it a user defined query, there will be three important sections to note. The first, being the query editor. This is where the query is written to select the data out of the tables. When the query is built, hitting the update button will display the results.
An important feature in the data source is use of parameters. Parameters are mainly useful for dropdown menus. To reference one, just use the number above in braces (Ex. {2}).
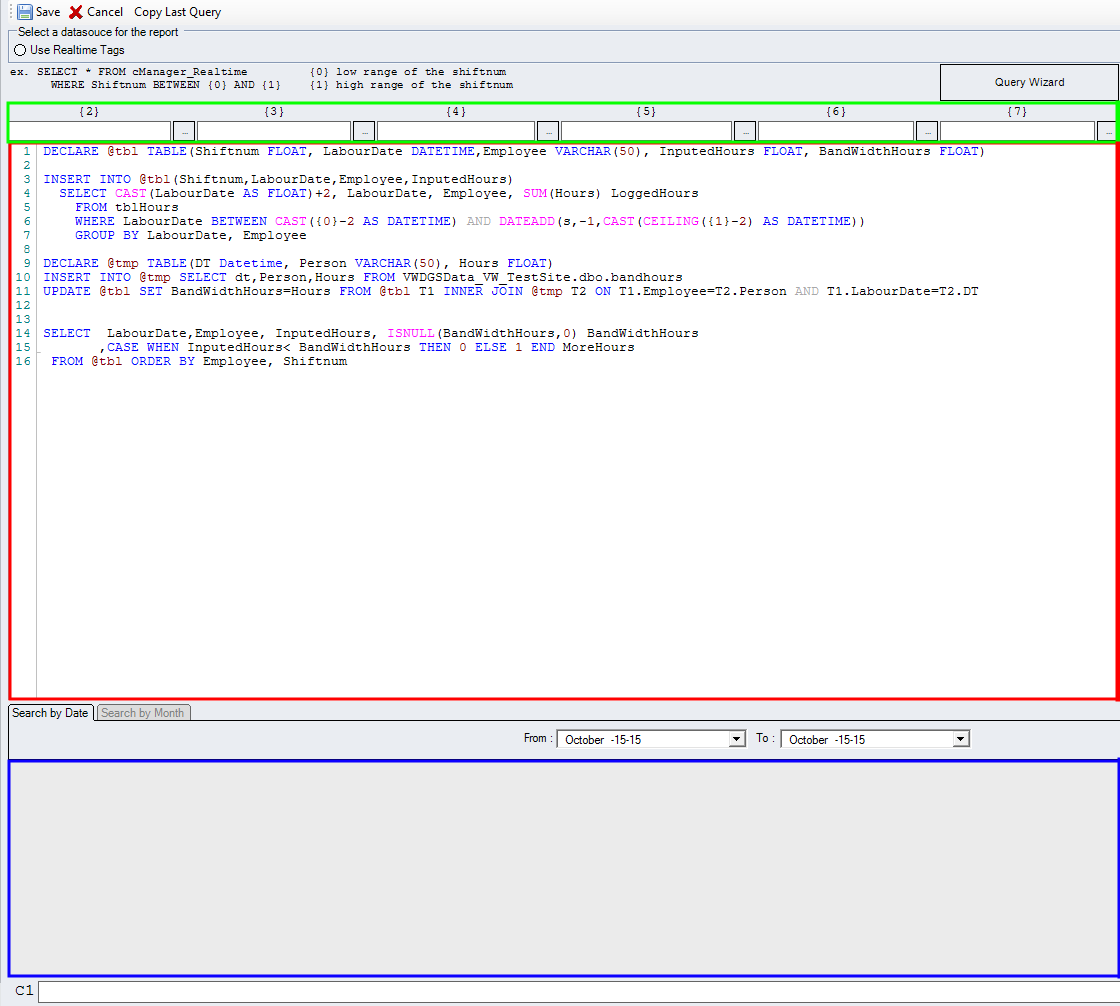
Saving Changes
When making changes or creating, make sure to hit the save button in the top left of the data source. If the changes were not as expected, cancel will undo all changes made since the last save.
All Other Important Properties
Appearance
- Font: Specifies the default font for the report.
Behavior
- DoEvents: Specifies whether to process messages while rendering the report
- MaxPages: Sets the maximum amount of pages a report can be.
Data
- DataSource: Opens up the datasource. Functions and uses are described above.
- InputLayout: Opens up an input to build for the report. All data on the input is placed into a temporary table that can be referenced in the report query.
- PassQueryParameters: Important to have on when using parameters inside of subreports.
- TimeOut: Sets the reports timeout duration.
Design
- FilterSettings:
- InterfaceScript:
- ReportMode: Sets the runtime options for the report
- ReportName: Names the report to be displayed in the tree.
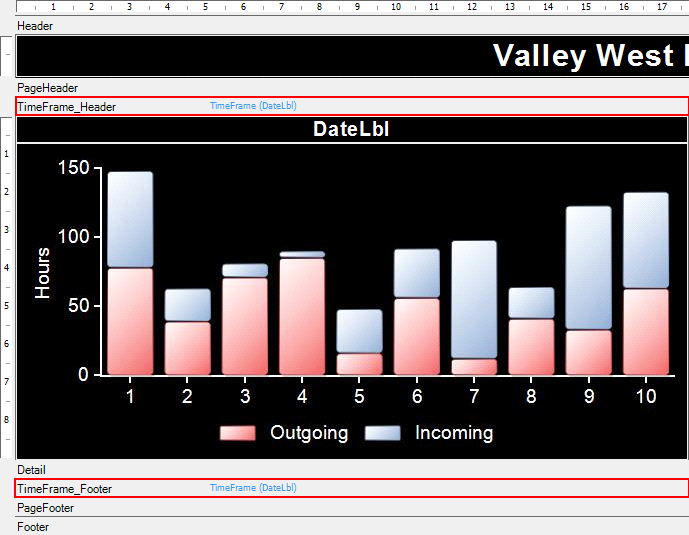
Groups
- Add/Remove: Allows grouping by a field in the report. In the example below the grouping would be on the date.
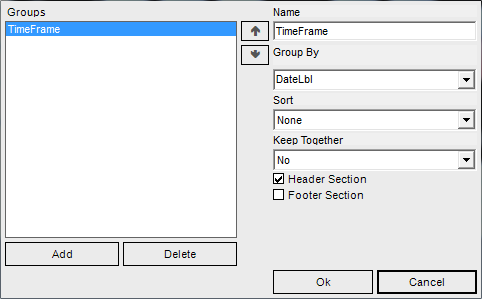
Once the group is set up, they will show in the body of the report.
Layout
- Layout: Specifies the page layout for the report. Can be expanded to reveal
Schedule
- DayInFirstWeekOfYear: Specifies what day must be the first of the year when using 5-4-4 methodology.
- DisplaySchedule: Set the specific schedule to choose from on the report.
- GroupSchedules: Removes the schedule code from the shiftnum on the date range picker.
- HideTab: Hides the specific tab when set to true.
- ShiftFilter: Filters by ScheduleCode.
- ShowInactiveShifts: Shows inactive shifts on the date selector.
- StartOfPeriod544: Requires Use544 to be set to true. Marks the day of the week periods of fiscal months.
- Use544: Changes the month and year ranges to use the 5-4-4 methodology
Script
Scripting on reports is mostly used for stylization. View the VW Scripting Page for the list of functions and tools in scripting. To reference an object/property, use ObjectName.Property as the correct name. Eg: Title.Color